2021
Moody’s Research Views
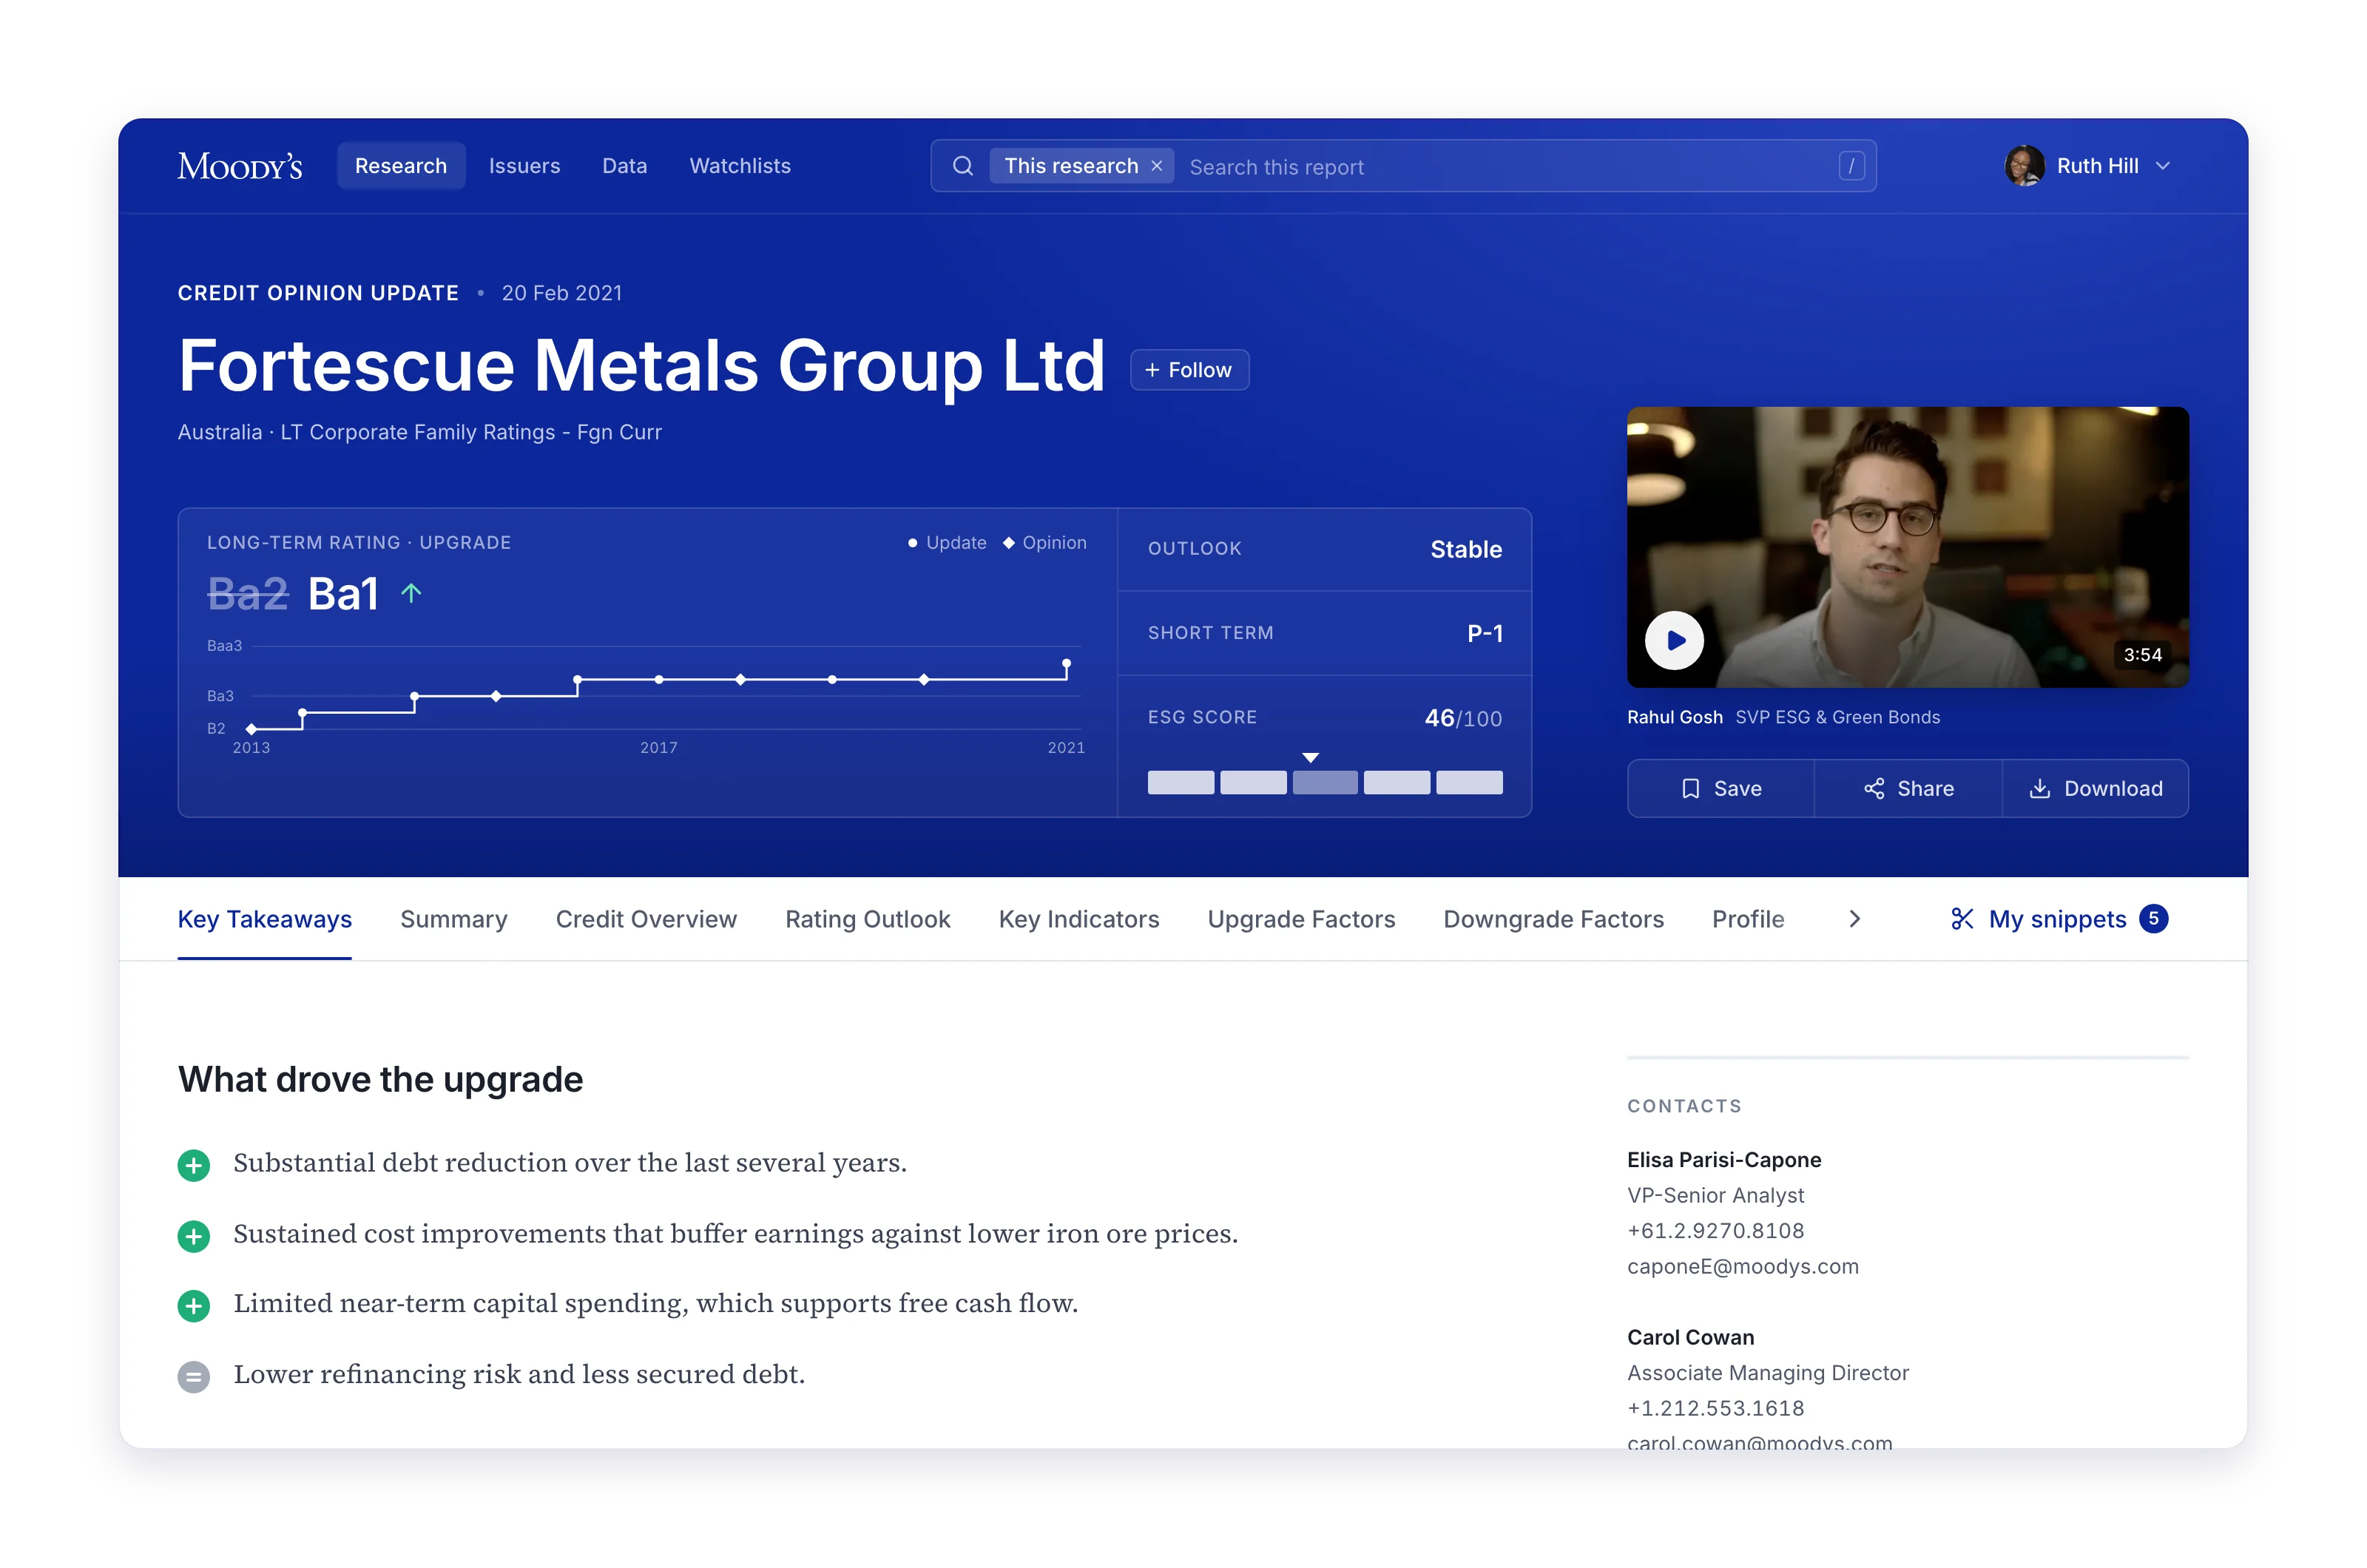
Research Views turned Moody’s credit opinions from long PDFs into pages analysts can work in: the rating action and its drivers up top, key indicators that chart against peers, a scorecard to test scenarios, and highlights that save to your snippets. We shaped it in a one-week design sprint, testing a prototype with users at the end of the week.
- Role
- I designed the sprint’s concept and built the prototype that users tested at the end of the week.
- Outcome
- The testing earned our team the brief to design the new Moodys.com.
- Product
- Moody’s Research Views, credit research
- Industry
- Financial Services
- Year
- 2021
A credit opinion that reads like a product
- Analysts read credit opinions the way they always had: top to bottom, then into a spreadsheet.
- We took one report and turned it into a page you can scan, compare, and keep.
The rating before the reading
- The header answers what changed before anything else: the upgrade from Ba2 to Ba1, the outlook, the short-term rating, and the ESG score, with the rating’s history beside it.
- The analyst’s brief sits next to it as a video, or as audio for the commute.

Notes that stay with the text
- Selecting a passage offers to save it or comment on it. Analysts’ own comments sit in the margin beside the line they’re about.
- Everything saved collects in My snippets, ready to download or share as a link.


Indicators you can compare
- Built for people who work in spreadsheets all day: each key indicator opens from a row in the table into a chart, with the forecast years shaded.
- Peers from the same sector join the chart from a search, and the view saves to your snippets with an annotation.

What would change the rating
- The scorecard shows how each factor feeds the rating. Entering your own measures runs a scenario, and the indicated outcome moves with them.

The same thinking, one level up
- The testing went well enough that our team was asked to design the new Moodys.com.
- The issuer pages took the report’s parts and laid them out as a grid: the rating and outlook up top, then news sentiment, risk signals, and key indicators an analyst can scan before opening any research.
- We tried it two ways, as tabs and as a single page.


Starting from the inbox
- Most readers arrive from an alert, so the email carries the rating action, the key exhibit, and the reasons for the upgrade, with one way into the full research.
